by Jason Thomas, President of Healthy Brand Oil
***NOT A TRADE RECOMMENDATION***
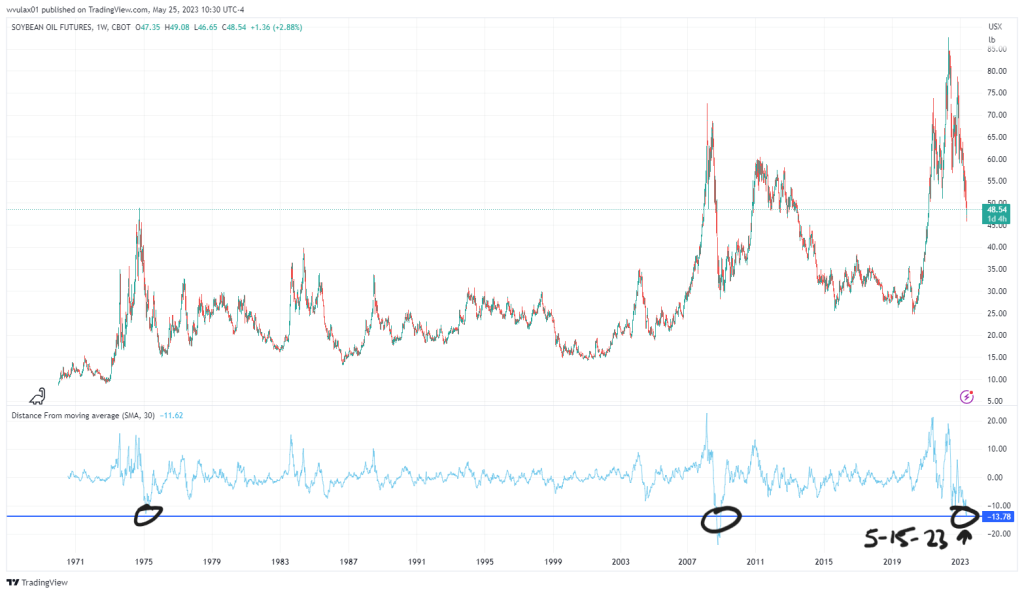
The attached two paned chart shows weekly soybean oil prices going back to 1971 on the top and the distance from a 30-period simple moving average on the bottom. I’ll explain why we use these settings more, but let’s jump into some findings first.
Last week the soybean oil market closed at the furthest distance (in percentage terms) from the 30-week (aka 150-day moving average) moving average since the Great Financial Crisis in late 2008. In addition, I could only find one other instance where this type of extreme reading came close back in early 1975. While these criteria for price performance to be classified extreme is admittedly narrow using this specific methodology, it is also objective and based on math, not my opinion. The bottom line for me is that this is the 2nd most extreme reading for soybean oil’s performance against its prior 30-week performance in fifty years.
But why is this significant? Markets tend to trade higher and lower than fundamentals would suggest for various reasons, fear, and greed mostly. We also know that commodity markets will tend to mean revert because higher prices disincentive usage and increase production and lower prices incentivize usage and decrease production. Or said another way a commodity’s supply/demand curve is self-correcting as prices trade to highs or lows. So, at a historical bearish reading, you would expect demand to increase, bringing prices back into some equilibrium. From a fundamental perspective, I can confirm we are seeing precisely that scenario, especially from renewable biodiesel producers.
Analysis based on a 30-week moving average should not be used to determine what prices will do in the coming days or weeks but is appropriate when assessing value for the next 6-12 months. Moving averages are great because they provide an automated and objective look at trend over a defined period. When using a 30-week moving average we are assessing multi month trends not daily or weekly.
So how can this analysis be used practically? Let’s look at a real-world example.
ABC Bakery has committed to locked-in pricing for six months on their muffins with their client XYZ Supermarket. If ABC Bakery has not purchased or hedged its input costs, it can see margin erosion if those costs rise. Since ABC is holding prices for six months to their customer, this creates an uncertain scenario where ABC cannot guarantee its margins even though they have secured significant volume at a “perceived” good sale price.
To mitigate these margin compression risks, ABC has multiple options. A simple solution is to book the future cost of the oil with a supplier, thereby locking in their margin on these future sales. Another option is to purchase a call option giving them the right but not the obligation to purchase oil at a price that would guarantee profits. This scenario comes at a small cost but allows ABC to guarantee profits and stay short the market providing margin expansion if the market were to trade lower.
That brings us to market timing. For ABC Bakery, purchasing or hedging soybean oil at a time when the price is the most extreme extended reading versus a 30-week moving average in fifteen years seems like a great place to step in and be a buyer or a hedger. Can the market go lower? Of course, it can, but when buying it this cheap versus the average price over the last 30 weeks and you are locking in profits against future sales, it’s a powerful combination that makes it hard to get hurt.